

Guide to OpenTelemetry Distributed Tracing in Rust


Table of contents
- What is OpenTelemetry? <a name="What-is-OpenTelemetry" />
- Opentelemetry and Distributed Tracing in Rust <a name="Opentelemetry-and-Distributed-Tracing-in-Rust"/>
- Practical OpenTelemetry Rust Example <a name="Practical-OpenTelemetry-Rust-Example"/>
- Creating the service <a name="Creating-the-service"/>
- Create our tracing setup <a name="Create-our-tracing-setup"/>
- Adding OpenTelemetry Instrumentation for Actix-Web framework <a name="Adding-OpenTelemetry-Instrumentation-for-Actix-Web-framework" />
- Visualizing traces with Aspecto <a name="Visualizing-traces-with-Aspecto"/>
- Manually instrumenting Rust functions <a name="Manually-instrumenting-Rust-functions"/>
- Adding OpenTelemetry Instrumentation for Diesel <a name="Adding-OpenTelemetry-Instrumentation-for-Diesel"/>
- How to preserve our span context when executing closures on different threads? <a name="How-to-preserve-our-span-context-when-executing-closures-on-different-threads"/>
- OpenTelemetry Distributed Tracing in Rust: Summary <a name="OpenTelemetry-Distributed-Tracing-in-Rust-Summary"/>

In this article, I will share my experience adding OpenTelemetry distributed tracing to a Rust application.
I will attempt to answer the following questions:
- How to instrument Opentelemetry in Rust?
- How to add manual and auto instrumentations to a Rust application?
- How to use tracing to debug Rust applications?
- How to visualize traces and spans?
- How to preserve our span context in a multithreaded environment?
- What are your must-know crates when it comes to tracing in Rust?
I will begin by saying that I love Rust as a programming language, and I’ve been experimenting with it for the past year. Although it’s innovative and has a great ecosystem, it is not a secret that Rust has quite a steep learning curve. So even though it’s an intro-level article, I will not dive deep into Rust features, syntax, or semantics unless it’s somehow connected to our subject (Opentelemetry and distributed tracing).
What is OpenTelemetry?
OpenTelemetry is a collection of APIs and SDKs that allows us to collect, export, and generate traces, logs, and metrics (also known as the three pillars of observability).
It is a CNCF community-driven open-source project (Cloud Native Computing Foundation, the folks in charge of Kubernetes).
In a cloud-native environment, we use OpenTelemetry (OTel for short) to gather data from our system operations and events. In other words, to instrument our distributed services. This data enables us to understand and investigate our software’s behavior and troubleshoot performance issues and errors.
OpenTelemetry serves as a standard observability framework that captures all data under a single specification. It provides several components, including:
- APIs and SDKs per programming language for generating telemetry.
- The OpenTelemetry Collector receives, processes, and exports telemetry data to different destinations.
- OTLP protocol for shipping telemetry data
To get a deeper understanding of this technology, including its structure and the primary motivation, visit this guide.
For this OpenTelemetry Rust article, here are the terms you need to know:
Span: The most basic unit. A span represents an event in our system (e.g., an HTTP request or a database operation that spans over time). A span would usually be the parent of another span, its child, or both.
Trace: ‘Call-stacks’ for distributed services. Traces represent a tree of spans connected in a child/parent relationship. Traces specify the progression of requests across different services and components in our app (DB, data sources, queues, etc.). For example, sending an API call to user-service resulted in a DB query to users-db.
Exporter: Once we create a span, the exporter handles sending the data to our backend (e.g., in memory, Jaeger Tracing, or console output)
Context propagation – The mechanism that allows us to correlate events across distributed services. Context is referred to as the metadata we collect and transfer. Propagation is how the context is packaged and transferred across services, often via HTTP headers. Context propagation is one of the areas where OpenTelemetry shines.
Instrumentation – instrumentation libraries gather the data and generate spans based on different libraries in our applications (Actix-Web, Postgres…).
To understand more of the OpenTelemetry jargon, visit the official documentation.
Opentelemetry and Distributed Tracing in Rust
Tracing in Rust
In Rust, we have a great crate simply called tracing. It is our core framework for tracing a Rust program. The crates documentation outlines its core concepts and APIs which are composed of these terms – spans, events, and subscribers.
I covered what Spans and Events are, but a Subscriber is a new term. To record spans and events, one has to implement the subscriber trait. That means simply implementing the methods:
- enter: indicating entering a span.
- exit: indicating ending a span.
- event: indicating an event has occurred.
To start recording traces, we need to initialize a subscriber. The crate _tracingsubscriber helps us to do exactly that.
We initialize the Registry struct:
let subscriber = tracing_subscriber::Registry::default()
This struct implements a subscriber and exposes us to another important feature of this crate – The Layer. Using layers, we can configure our Subscriber to apply specific behaviors when interacting with spans and events.
For example, if we want to filter some of our data, export it, format it or edit it, we can create or use an existing layer and compose it with the registry subscriber.
let subscriber = tracing_subscriber::Registry::default().with(SomeLayer)
We will see more examples of how to use these crates to instrument a Rust program in the practical section.
OpenTelemetry in Rust
The crate that provides support for OpenTelemetry is called – how convenient – OpenTelemetry [see here].
“OpenTelemetry provides a single set of APIs, libraries, agents, and collector services to capture distributed traces and metrics from your application.”
Let’s go over some of its key APIs:
Tracer. Inside the crate, there is a module called traces. It introduces us to a trait called Tracer. This is what tracks and connects our spans to create traces. To use Tracer, we create a subscriber layer. This is how the subscriber knows where to send the spans and how to generate traces.
Global. This module provides an API so that no matter in what section of the code we currently are, we can access the subscriber, tracer, and propagation context.
SDK. This module provides an implementation for common use cases with OpenTelemetry. For example, it provides an exporter to send traces to stdout. It also implements context propagation methods that we can use instead of implementing ourselves.
The git repository called opentelemetry-rust contains implementations of several crates that expand the opentelemetry ecosystem. There you can find common instrumentations, exporters, and subscribers use them in a Rust program.
OpenTelemetry Distributed tracing in Rust
Using crates from the opentelemetry-rust repo, we can instrument our application across multiple services and send them to a distributed platform.
For example, we can use the opentelemetry-jaeger crate to send our traces to a remote Jaeger platform.
Another example is the OpenTelementy-otlp crate.
Traces in OTLP format can be exported to the OpenTelemetry Collector using the exporter in this crate. OpenTelemetry Collector accepts, processes, and exports traces in a vendor-agnostic manner.
Practical OpenTelemetry Rust Example
For this example, I wanted to build a simple system I could use to integrate and visualize traces. I found auto-instrumentations for Actix-Web Framework and Diesel, an ORM and Query builder utility for SQL-based databases.
I chose to use these tools and build a simple REST api service to create, read and delete users following the examples given by these frameworks.
Here is a link for the source code.
Creating the service
First, I followed the Actix web and diesel documentation and created a simple web server that exposes a user service and communicates with a local Postgres database:
mod models;
mod schema;
mod users;
#[macro_use]
extern crate diesel;
extern crate dotenv;
use dotenv::dotenv;
use actix_web::{web, App, HttpServer};
use diesel::r2d2::{self, ConnectionManager};
use diesel::pg::PgConnection
use telemetry::init_telemetry;
use users::get_users_service;
pub type Connection = PgConnection
pub type DbPool = r2d2::Pool<ConnectionManager<Connection>>;
#[actix_web::main]
async fn main() -> std::io::Result<()> {
  dotenv().ok();
  let database_url = std::env::var("DATABASE_URL").expect("DATABASE_URL must be set");
  let manager = ConnectionManager::<InstrumentedPgConnection>::new(database_url);
  let pool: DbPool = r2d2::Pool::builder()
      .build(manager)
      .expect("Failed to create pool.");
  HttpServer::new(move || {
      App::new()
          .app_data(web::Data::new(pool.clone()))
          .service(get_users_service())
  })
  .bind(("127.0.0.1", 3000))?
  .run()
  .await
}
For this blog, I will only show one endpoint and its flow. You can find the rest in the source code.
use crate::DbPool;
use crate::{models::NewUser};
use actix_web::{delete, get, post, web, Error, HttpResponse};
use uuid::Uuid;
#[post("")]
async fn create_user(
  db: web::Data<DbPool>,
  new_user: web::Json<NewUser>,
) -> Result<HttpResponse, Error> {
  let user = web::block(move || {
      let conn = db.get()?;
      db_operations::insert_new_user(&new_user.name, &conn)
  })
  .await?
  .map_err(actix_web::error::ErrorInternalServerError)?;
  Ok(HttpResponse::Ok().json(user))
}
pub fn get_users_service() -> actix_web::Scope {
  web::scope("/users")
      .service(get_users)
      .service(get_user_by_id)
      .service(create_user)
      .service(delete_user)
}
mod db_operations {
pub fn insert_new_user(nm: &str, conn: &PgConnection) -> Result<models::User, DbError> {
  use crate::schema::users::dsl::*;
  let new_user = models::User {
      id: Uuid::new_v4().to_string(),
      name: nm.to_owned(),
  };
  diesel::insert_into(users).values(&new_user).execute(conn)?;
  Ok(new_user)
}
}
Create our tracing setup
Now that I have a working service, I can add telemetry data. I will need to configure a tracing subscriber and its layers.
use opentelemetry::sdk::export::trace::stdout;
use opentelemetry::sdk::propagation::TraceContextPropagator;
use opentelemetry::sdk::{trace, Resource};
use opentelemetry::KeyValue;
use opentelemetry::{global};
use std::collections::HashMap;
use std::env;
use tracing_subscriber::Registry;
use tracing_subscriber::{prelude::*, EnvFilter};
pub fn init_telemetry() {
  // Define Tracer
  let stdout_tracer = stdout::new_pipeline().install_simple();
  let subscriber = Registry::default();
  // Layer to filter traces based on level - trace, debug, info, warn, error.
  let env_filter = EnvFilter::try_from_default_env().unwrap_or(EnvFilter::new("INFO"));
  // Layer to add our configured tracer.
  let tracing_leyer = tracing_opentelemetry::layer().with_tracer(stdout_tracer);
  // Setting a trace context propagation data.
  global::set_text_map_propagator(TraceContextPropagator::new());
  subscriber
      .with(env_filter)
      .with(tracing_leyer)
      .init();
}
This configuration adds an env_filter layer and a tracing layer. It prints to stdout all spans that their level is equal to or above the “info” log level.
Adding OpenTelemetry Instrumentation for Actix-Web framework
Now let’s add some spans by instrumenting the actions we take. Let’s start by instrumenting the operation taken by Actix web.
For that, I will use the actix_web_opentelemetry crate which provides a middleware called RequestTracing. As its name suggests, this middleware extracts trace information from the request and creates a span with the same context.
use actix_web_opentelemetry::RequestTracing;
// add the middleware to the server.
HttpServer::new(move || {
      App::new()
          .wrap(RequestTracing::new())
          .app_data(web::Data::new(pool.clone()))
          .service(get_users_service())
Now, when running the application and invoking the create user endpoint, we print spans to the terminal.
Trying to understand something from this print is quite hard. Besides, we are gathered here today to visualize traces, not to print them to the terminal.
So I changed the tracer to export traces to an OTLP collector. I configured the tracer to send traces to the Aspecto platform.
Visualizing traces with Aspecto
To follow along, you can open a new free-forever Aspecto account or log in to your existing one.
Below, make sure to replace the {ASPECTO_API_KEY} with your unique Aspecto token ID – https://app.aspecto.io/app/integration/token (Settings > Integrations > Tokens)
use opentelemetry_otlp::WithExportConfig;
let exporter = opentelemetry_otlp::new_exporter()
      .http()
      .with_endpoint("https://otelcol.aspecto.io/v1/traces")
      .with_headers(HashMap::from([(
          "Authorization".into(),
          env::var("ASPECTO_API_KEY").unwrap().to_string(),
      )]));
let otlp_tracer = opentelemetry_otlp::new_pipeline()
      .tracing()
      .with_exporter(exporter)
      .with_trace_config(
          trace::config().with_resource(Resource::new(vec![KeyValue::new(
              opentelemetry_semantic_conventions::resource::SERVICE_NAME,
              env::var("SERVICE_NAME").unwrap().to_string(),
          )])),
      )
      .install_batch(opentelemetry::runtime::Tokio)
      .expect("Error - Failed to create tracer.");
let tracing_leyer = tracing_opentelemetry::layer().with_tracer(otlp_tracer);
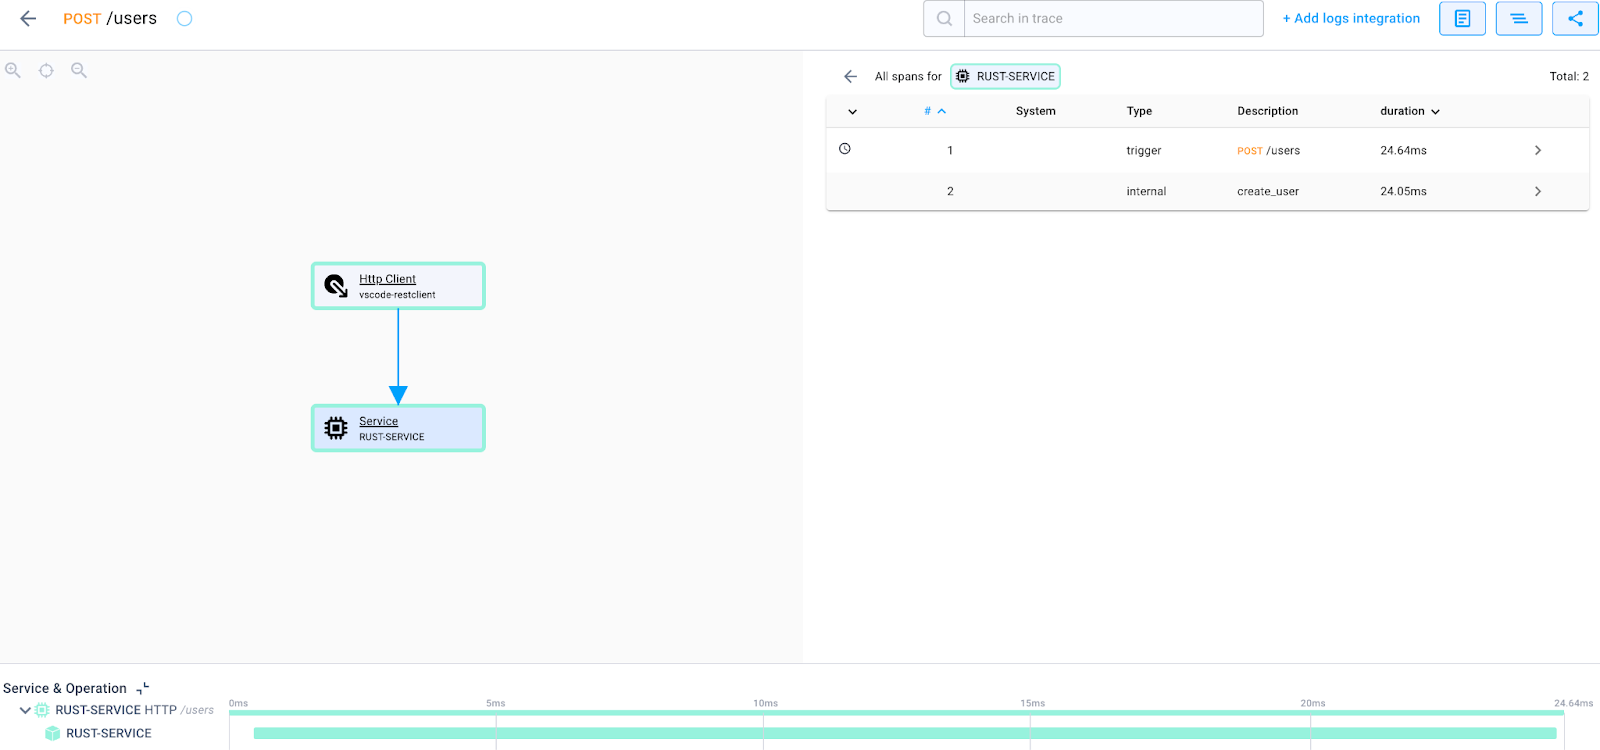
When running the application once more, I can view my traces in Aspecto:

Clicking the trace, I can view the spans and their data:

Manually instrumenting Rust functions
Let’s add more instrumentations to our service.
By using the macro #[instrument] on a function, we can create a span for this function.
It means that the span name will be the name of the function. Its attribute will include the module crate, the library of the function, and the function’s attributes.
By using instrument(skip(…), field(…)), we can skip some of the arguments of a function that are not important for us to record and manually insert new attributes.
Let’s give it a go:
#[instrument(skip(db))]
#[post("")]
async fn create_user(
  db: web::Data<DbPool>,
  new_user: web::Json<NewUser>,
) -> Result<HttpResponse, Error> {
  let user = web::block(move || {
      let conn = db.get()?;
      db_operations::insert_new_user(&new_user.name, &conn)
  })
  .await?
  .map_err(actix_web::error::ErrorInternalServerError)?;
  Ok(HttpResponse::Ok().json(user))
}
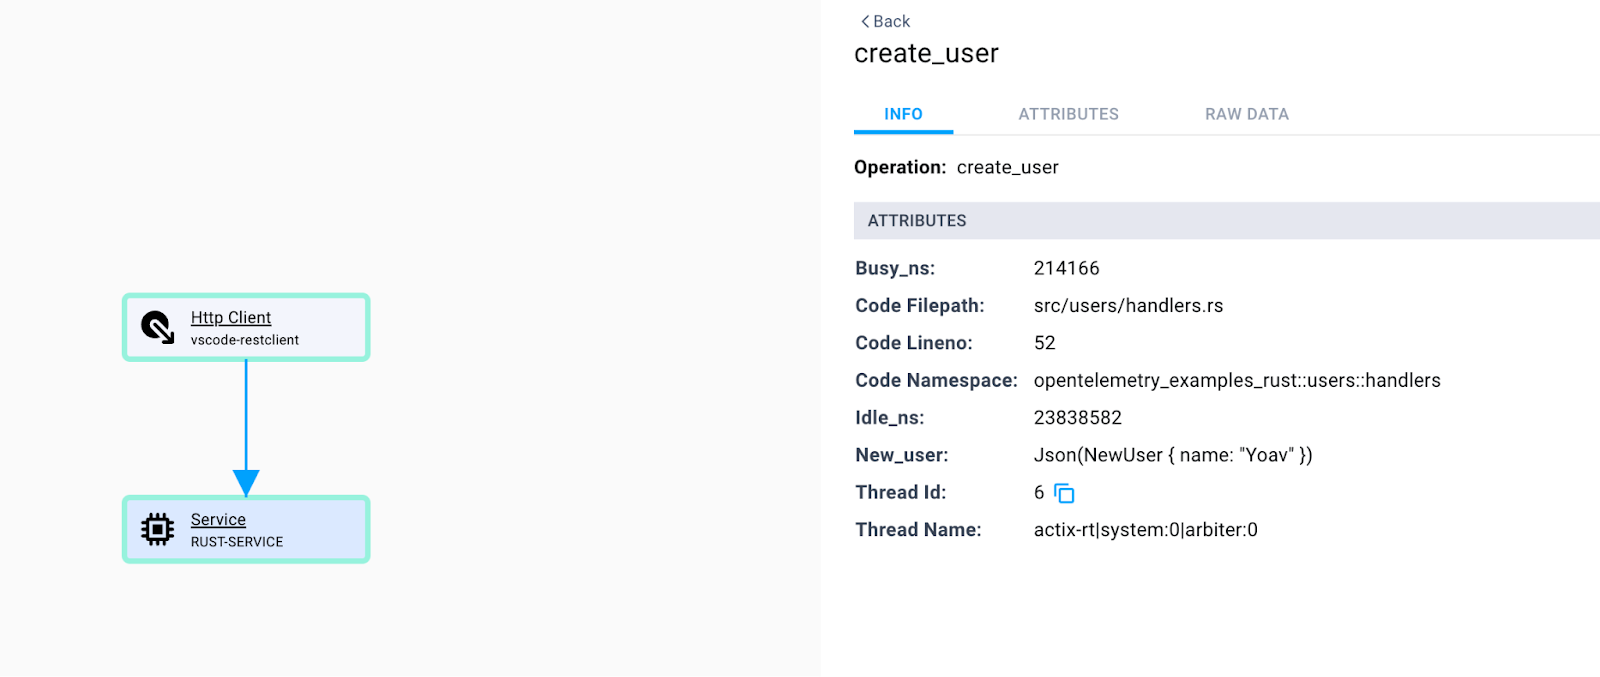
I now added instrumentation for the function create_user. I skipped the db parameters. Let’s view this new span in Aspecto:
We can clearly see the new span added to the trace. Clicking the new span we can see all the attributes I mentioned before:
Adding OpenTelemetry Instrumentation for Diesel
To get a full picture, I will add the instrumentation for the db_operation function:
#[instrument(skip(conn))]
pub fn insert_new_user(nm: &str, conn: &Connection) -> Result<models::User, DbError> {
  use crate::schema::users::dsl::*;
  let new_user = models::User {
      id: Uuid::new_v4().to_string(),
      name: nm.to_owned(),
  };
  diesel::insert_into(users).values(&new_user).execute(conn)?;
  Ok(new_user)
}
And for the diesel library which we are using. To add the diesel instrumentation we will need to use the _dieseltracing crate and replace our PgConnection with InstrumentedPgConnection:
use diesel_tracing::pg::InstrumentedPgConnection;
pub type Connection = InstrumentedPgConnection;
pub type DbPool = r2d2::Pool<ConnectionManager<Connection>>;
I ran the application once more and observed the traces in Aspecto:
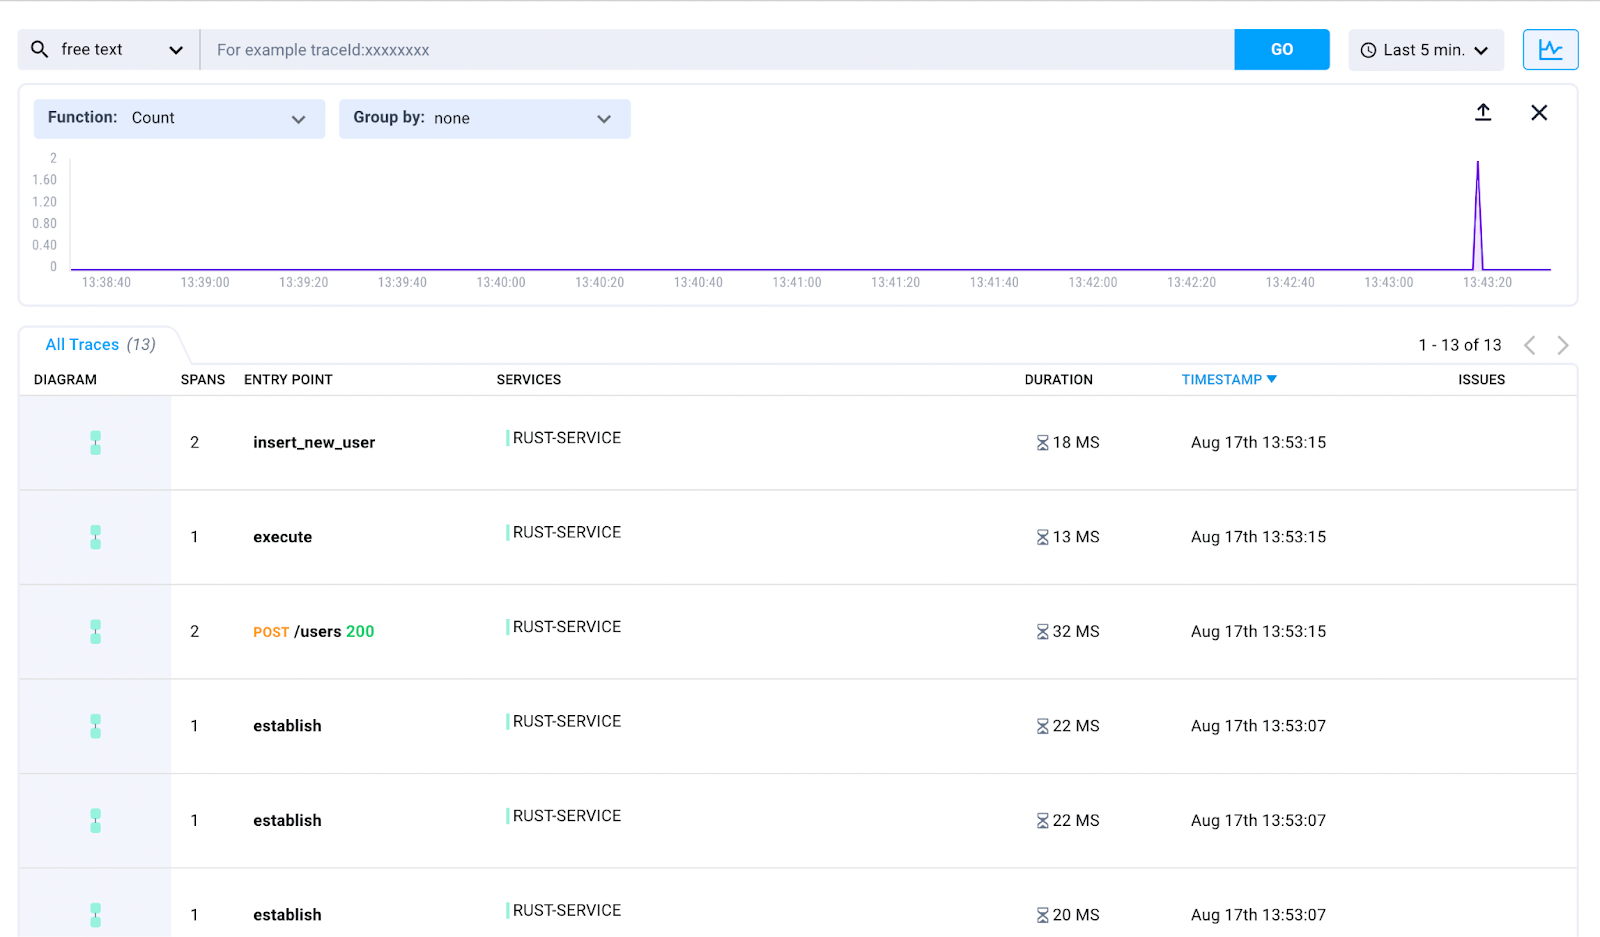
We can see many unrelated traces. This is because the database connection struct communicates with the database periodically by calling the establish function to make sure the connection is still live.
How to preserve our span context when executing closures on different threads?
But there is a problem here. Can you see it? For some reason, the spans representing our request and the spans representing the database query are not grouped together. This is happening because of this code:
#[instrument(skip(db))]
#[post("")]
async fn create_user(
  db: web::Data<DbPool>,
  new_user: web::Json<NewUser>,
) -> Result<HttpResponse, Error> {
  let user = web::block(move || {
      let conn = db.get()?;
      db_operations::insert_new_user(&new_user.name, &conn)
  })
  .await?
  .map_err(actix_web::error::ErrorInternalServerError)?;
  Ok(HttpResponse::Ok().json(user))
}
We are invoking our db operation inside a closure we pass to the web::block function. We lose the span context of our execution flow. However, the web::block function is crucial.
It executes a blocking function on a thread pool dedicated to async blocking operations. So how can we keep the context of the trace?
We can do that by wrapping the web::block function with our own tracing function:
fn traced_web_block<F, R>(f: F) -> impl Future<Output = Result<R, BlockingError>>
where
  F: FnOnce() -> R + Send + 'static,
  R: Send + 'static,
{
  let current_span = tracing::Span::current();
  web::block(move || current_span.in_scope(f))
}
Here we get our current span and invoke the closure within its scope.
Let’s view our traces now:
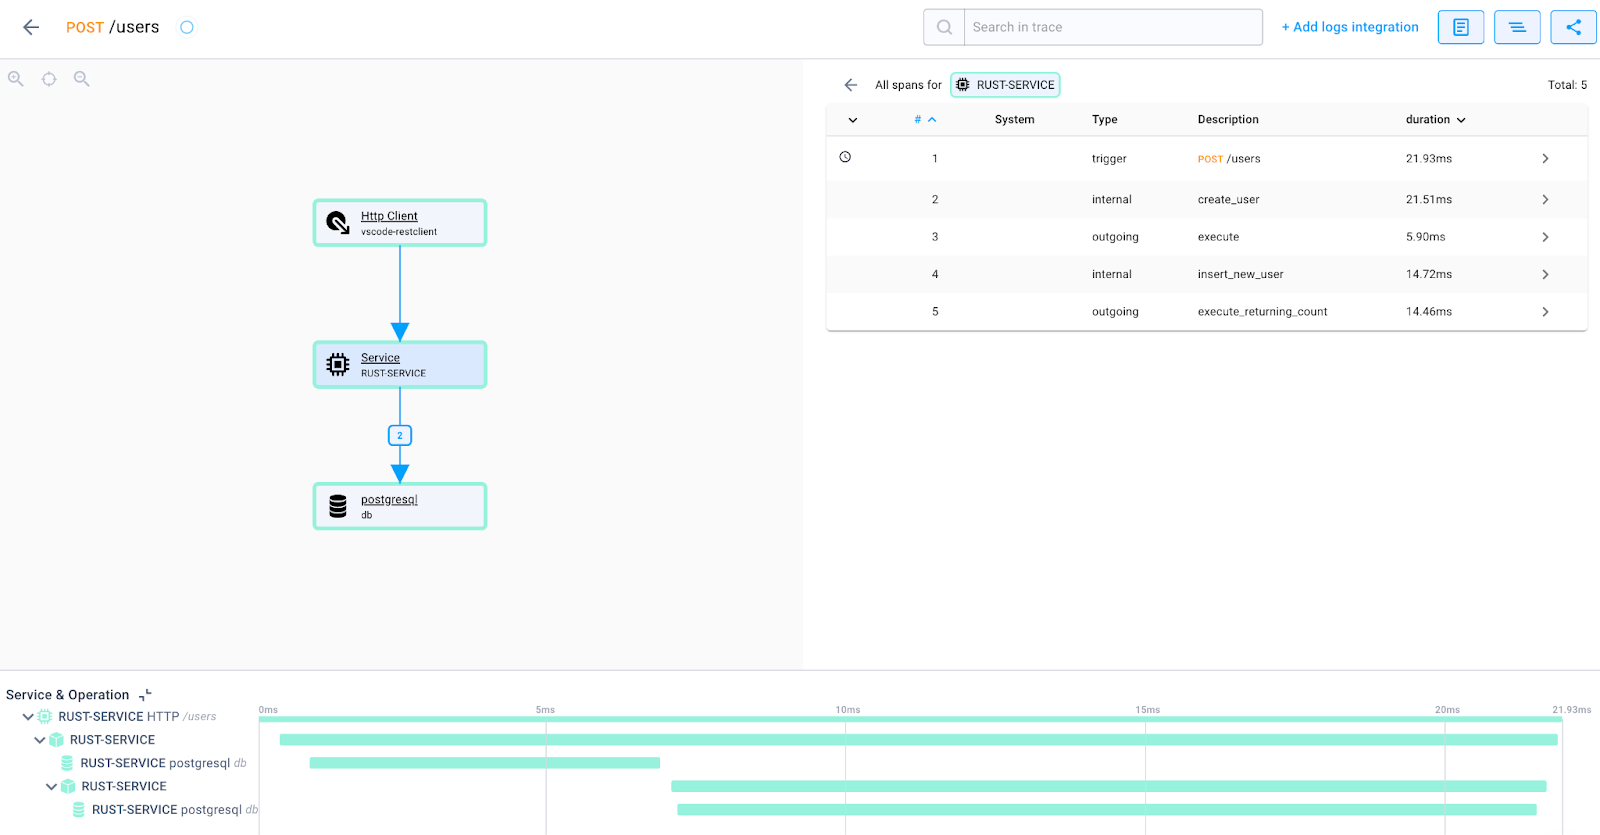
We can now get a full picture of the flow of our application.
OpenTelemetry Distributed Tracing in Rust: Summary
We reviewed how to add distributed tracing with OpenTelemetry to the Rust application. We explored how to add both manual instrumentation and library-provided instrumentations.
We used Aspecto to visualize the flow of our system and learned what to do when the flow is broken.
To sum up, I enjoyed working on this example. I think the approach Rust is taking regarding tracing is interesting and worth considering when writing a Rust program. Furthermore, the ecosystem is growing so I am sure more libraries will provide instrumentations soon.
I hope you learned something new. Feel free to reach out with any questions you might have.